Task Force on Climate-related Financial Disclosures
Key facts
- 2.912GWof renewable assets connected to our network
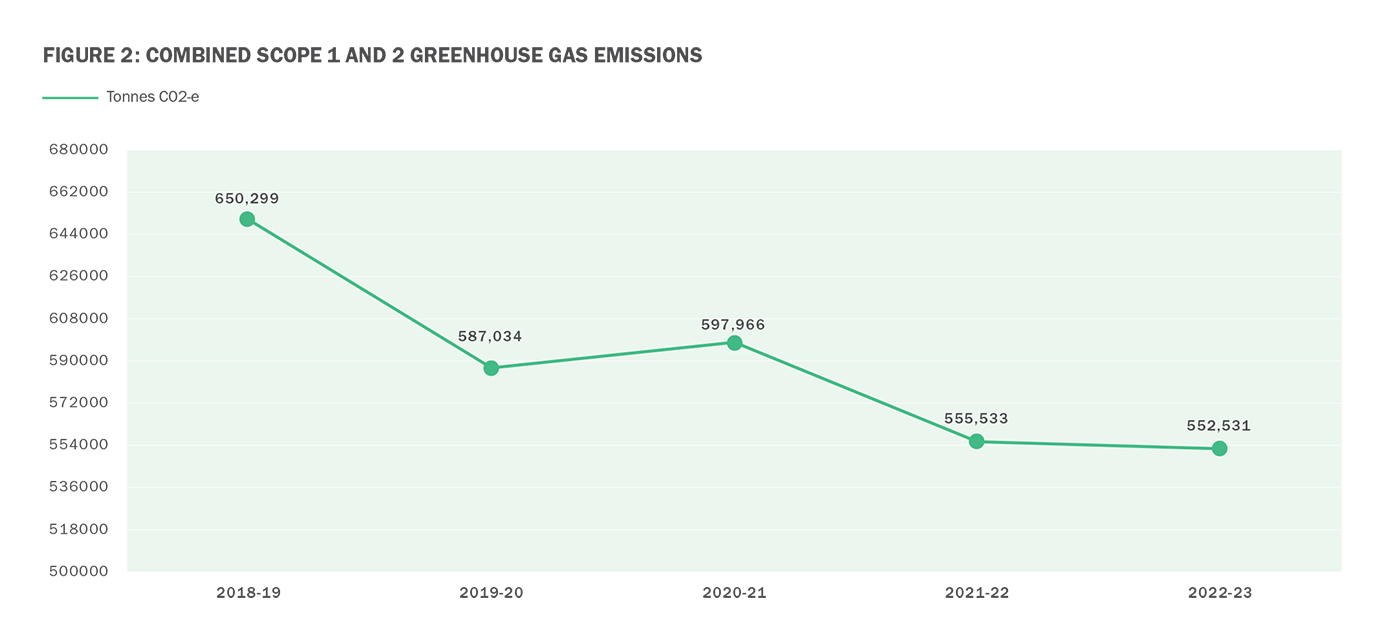
- 15%reduction in Scope 1 and 2 emissions over the past 5 years
- 4Stand Alone Power Systems
Essential Energy recognises that this disclosure is an early adoption based on best endeavours, delivered ahead of sector-wide guidance being available, and therefore there may be limitations to the robustness and consistency of reporting.
Governance
Board role and responsibilities
The Board (page 49 of Annual Report 2022-23 PDF) has ultimate oversight of our strategic response to climate change, which is delivered primarily through our Corporate Strategy, Sustainability Strategy, Strategic Asset Management Plan and Regulatory Proposal. Responses to our climate-related risks and opportunities are threaded through these documents.
The Board approves our Sustainability Strategy. The Strategy’s ‘Responding to Climate Change’ pillar contains three commitments: Building climate resilience, Facilitating the net zero transition, and Decarbonising our operations. In February 2023, the Board approved metrics and targets for this pillar (see table 8 below), which will help it to monitor our performance.
Our Corporate Strategy is approved by the Board and explicitly references multiple transition opportunities, including facilitating electric vehicle (EV) adoption and enabling smart energy solutions for rural and regional communities.
Other transition risks and opportunities arising from climate-related regulation, policy or market activity are considered and addressed by the Board as part of business-as-usual strategic and financial planning. The Corporate Strategy is monitored quarterly.
Climate and sustainability topics are specifically discussed by multiple Board sub-committees, including:
- The Safety, Human Resources and Environment Committee, which reviews performance against the Sustainability Strategy on a quarterly basis
- The Risk and Cyber Security Committee, which a) ensures an appropriate framework for identifying and managing risks arising from climate change (including physical, transitional and liability risks), and b) monitors strategic and business risks, including climate change and other sustainability and environmental risks
- The Audit Committee, which oversees and reviews TCFD and other public disclosures regarding sustainability.
The Board (together with Management) continues to increase its understanding of the implications of climate on our business and sector, including through training and education sessions on topics such as climate reporting standards. This positions the Board to continue to steer the organisation towards best practices, including on the measurement and disclosure of climate-related information.
Management’s role and responsibilities
Management is responsible for delivering on the Corporate Strategy, as well as the Sustainability Strategy, Asset Management plans and Regulatory Proposal. This responsibility includes executing new opportunities for sustainability-led business growth, including – explicitly – facilitating EV adoption and enabling smart energy solutions in rural and regional New South Wales (NSW).
Management reviews performance against the Sustainability Strategy on a quarterly basis. The Sustainability Steering Committee, on which the entire Executive (Management) team sits, is a subcommittee chaired by the Chief Corporate Affairs Officer. This Committee is responsible for addressing key risks and issues regarding the implementation of the Sustainability Strategy.
Over the past year, the Sustainability Steering Committee has:
- endorsed performance metrics and targets for Board approval (including those under the ‘Responding to climate change’ pillar of the Sustainability Strategy)
- confirmed priorities for TCFD reporting initiatives
- actioned the development of decarbonisation pathways for emissions sources
- endorsed a Scope 3 emissions baseline and forecast project.
The Sustainability and Climate Working Group is responsible for the delivery of the Sustainability Strategy and climate-related initiatives. It meets monthly, is chaired by the Head of Sustainability and includes representatives from across the organisation.
Over the past year, the Working Group has undertaken climate education sessions, including two half-day workshops on climate change and scenario modelling.
Strategy
Essential Energy has a large geographical network area covering regional, rural and remote communities, and we are seeing changing expectations as a result of communities’ experience of climate impacts. More broadly, we are also seeing shifting expectations of us as an organisation from investors, insurers, customers and society.
These shifts manifest in two main types of impact on Essential Energy, from which emerge our climate-related risks and opportunities. The first concerns the physical environment we operate in, which impacts assets we own and the way our network is managed. The second concerns the broader market and economy that we operate within, which in turn affects the value the network generates, our role in the overall industry, and the services customers are offered in the future.
As a regulated distribution network provider there is an inherent risk that the regulatory framework does not align with the expectations of our key stakeholders when it comes to climate risk and climate action. The National Electricity Rules govern the economic regulation of electricity distribution networks which seeks to promote efficient investment in, and efficient operation and use of, electricity services. How this framework evolves to accommodate new components, like emissions, resilience or emerging climate threats, is an ongoing evolution of the legislative mechanism.
Our climate risks and opportunities
While developing our current Corporate Strategy in 2020-21, the Board and Management Team conducted an extensive review of the external landscape, including technological possibilities, economic trends and enabling regulatory plans and frameworks1. This review supported a discussion of Essential Energy’s desired role within the energy transition, as well as the identification of a set of transition risks and opportunities, which are reflected in our Corporate Strategy and Sustainability Strategy.
Physical climate risks, for their part, have long been established considerations within our network management processes. We maintain a register of physical risks affecting the electricity network, including those relating to weather events, such as bushfires, storms, floods and sea-level rise. The impacts of these risks could potentially involve the failure of network assets or an inability to respond to significant network outages due to limited physical access to the network.
Tables 5 and 6 below provide a shortlist of material climate-related risks and opportunities, to combine both our physical and transition risks, on the one hand, and our transition opportunities on the other.
- For example, relevant regulatory plans include (all at NSW Government level) the Net Zero Plan Stage 1 (2020-2030), Electricity Infrastructure Roadmap, Electric Vehicle Strategy and Hydrogen Strategy. As part of the Electricity Infrastructure Roadmap, the NSW Government plans to deliver the state’s first five Renewable Energy Zones, three of which are directly within our network area.
| RISK 1: EXTREME WEATHER EVENTS (FLOODS, WINDSTORMS, DROUGHTS, HEATWAVES) | |
|---|---|
| Type: Physical – Chronic and Acute | Time horizon: Short term |
| POTENTIAL IMPACT | BUSINESS RESPONSE |
|
|
| RISK 2: BUSHFIRES | |
| Type: Physical – Acute | Time horizon: Short term |
| POTENTIAL IMPACT | BUSINESS RESPONSE |
|
Same as Risk 1. |
Same as Risk 1. As well as general resilience-boosting measures delivered in the Asset Management function and outlined in the Sustainability Strategy, specific responses for bushfire risk include installing composite poles and undergrounding wires in bushfire-prone areas. In 2022-23, we partnered with Melbourne University to complete a detailed review of our bushfire modelling across our entire operational footprint, using industry-leading modelling and technical capabilities. This helps us to mitigate the risk of our assets being involved in starting fires, as well as that our assets can withstand impacts from fires so far as reasonably practicable. This means we can maintain a safe and reliable network for our customers in regional NSW. |
| RISK 3: SUPPLY CHAIN DISRUPTIONS AND SHORTAGES (KEY MATERIALS, SKILLS, TECHNOLOGIES) | |
| Type: Transition – Technology | Time horizon: Short term |
| POTENTIAL IMPACT | BUSINESS RESPONSE |
|
Risk mitigation measures against supply chain disruptions include:
|
| RISK 4: FUTURE ENERGY VOLATILITY | |
| Type: Transition – Market | Time horizon: Short term |
| POTENTIAL IMPACT | BUSINESS RESPONSE |
|
|
| OPPORTUNITY 1: NOVEL TECHNOLOGIES FOR NETWORK RESILIENCE | |
|---|---|
| Type: Resource efficiency/Resilience | Time horizon: Short to medium term |
| POTENTIAL IMPACT | BUSINESS RESPONSE |
|
Essential Energy is continuing to develop a series of new solutions that add flexibility and resilience to the network:
|
| OPPORTUNITY 2: ACCELERATED ELECTRIFICATION OF INDUSTRY AND HOUSEHOLDS | |
| Type: Markets | Time horizon: Short term |
| POTENTIAL IMPACT | BUSINESS RESPONSE |
|
Essential Energy stands to benefit from a substantial increase in load consumption as customers electrify. This is supported through government policies that provide funding or legislative requirements for households, industry and transport sector to reduce emissions. |
|
| OPPORTUNITY 3: NEW MARKETS AND TECHNOLOGY | |
| Type: Markets Technology | Time horizon: Short term |
| POTENTIAL IMPACT | BUSINESS RESPONSE |
|
The energy transition is opening the possibility of new business models and new routes to value, which is a significant opportunity in regional and rural NSW. This could lead to expansion of services or adjacent markets. |
|
Scenario modelling
Physical risks
Physical climate modelling is a unique and specialist field. In 2021-22 and 2022-23, we engaged external specialists to undertake a Climate Impact Assessment (CIA), which modelled scenarios to quantify the financial and non-financial impacts of physical climate events on our network assets. This modelling was based on multiple inputs, including emissions trajectories created by the Intergovernmental Panel on Climate Change (specifically, Representative Concentration Pathways (RCPs) 4.5 and 8.5 over the time horizons of 2050, 2070 and 2090). This will inform future network investment strategies with a view to proactively addressing the long-term horizon impacts of climate change.
Transition risks and opportunities
During 2022-23, we conducted a strategic scenario planning workshop to better understand the risks and opportunities generated by the broad market response to climate change, which will appear in conjunction with physical changes to the climate. The workshop was attended by senior leaders and subject matter experts from across the business (including finance, risk, asset management, future networks, regulatory affairs, human resources, corporate strategy, sustainability, commercial and Essential Water).
Our workshop approach built on the analysis underpinning our Corporate Strategy, which includes forecasts of multiple factors (such as renewable uptake, population and electricity demand) over the medium term. We mapped these forecasts out to three longer-term climate scenarios, which were a combination of physical risks (from our CIA) and other reference material (such as the Shared Socioeconomic Pathways) that could help us to understand the social, technical and economic impacts of a changing climate on our customers.
These scenarios ultimately sketched out three possible future states which senior leaders could use to explore and evaluate future impacts on the energy sector. The scenarios are outlined in table 7.
| SCENARIO | FEATURES | ENERGY SECTOR IMPLICATIONS |
|---|---|---|
| Accelerated action (<2 degrees) |
|
|
| Green growth (>2, <3 degrees) |
|
|
| Slow progress (>3 degrees) |
|
|
Ongoing resilience of our network
In 2021-22 we engaged with Resilience NSW (now the NSW Reconstruction Authority) to develop a joint discussion paper on network resilience. We then hosted a joint public forum to uncover the ways in which networks could best support communities in responding to an unpredictable climate over the next decade. Much of the feedback we received suggested focusing on supporting local resilience planning and community education.
Our Network Resilience Plan outlines our business response to this engagement journey, including a range of network and non-network initiatives aimed at improving both network and community resilience (including in partnership with broader community-level plans). Customers and other stakeholders strongly supported investments in both areas.
Specific initiatives in the plan include:
- Use of composite power poles for identified risk-based replacements. Composite poles are more resilient to withstanding fires
- Undergrounding of targeted overhead power lines
- Installing SAPS and microgrids, enabling the retirement of targeted long radial overhead powerlines in the highest bushfire risk locations
- Installing solar and battery backups at key radio tower sites
- Establishing a fleet of portable assets to support communities impacted by long duration power outages. These include a portable depot for our workforce to operate from, generators of various sizes, portable streetlights, solar panels, batteries, switchboards and a community hub support van.
The plan has been used to inform our 2024-29 Regulatory Proposal submission.
Risk management
As detailed above, in 2021-22 and 2022-23, we engaged external specialists to undertake a CIA, modelling the expected impact of the physical impacts of climate change on our network assets and customer experience. We combined historic asset failure data with expert judgement and a literature review. We also used the NSW Government Climate Risk Ready tool to supplement existing risk assessments and identify risks that may benefit from longer-term quantitative assessments to identify potential impacts and mitigation options.
The assessment produced comprehensive forecast models for bushfires, floods and windstorms, including location-specific data that informed the projected timings and plans required for mitigative measures. In evaluating our physical risks, we modelled the projected impact on the customer experience as a result of climate-driven sustained power outages using an industry standard metric known as the Value of Customer Reliability. This generated economic quantification of the impacts of sustained power outages as a result of the increase in climate-driven bushfires, floods and windstorms.
As an electricity network owner, we evaluate and address our physical risks as part of business-as-usual risk management, primarily through our Strategic Asset Management Plan and individual asset management strategies. Risks are rated according to a common risk matrix identifying likelihood and potential consequences. Through our risk management framework, we also assess the possibility of additional organisation impacts from the failure of an asset, for example on safety, reliability, financial performance, the environment, compliance, reputation or community standing.
Essential Energy recognises that it is not practical or efficient to eliminate the potential impacts of natural hazards and extreme weather events. Our approach to limiting the impact of these events includes maintaining incident response capabilities that mitigate the physical impacts of climate hazards and disaster events such as floods, storms and bushfires, by restoring power following outages caused by extreme weather events.
Our existing risk register includes risks affected not only by physical risks but also transition risks. These are not necessarily tagged as climate risks as both their causes and impacts can be broader. For example, energy volatility could derive from climate risks or other factors. Risks are rated according to a common risk matrix identifying likelihood and potential consequences. These risks are all addressed at Board and Management level, mostly through ongoing monitoring of the factors underpinning our Corporate Strategy and the metrics and targets identified in our Sustainability Strategy (see tables 8 to 10 below).
Metrics and targets
The ‘Responding to Climate Change’ pillar of our Sustainability Strategy contains three commitments:
- Facilitating the net zero transition
- Building climate resilience
- Decarbonising our operations
In 2022-23 the Board approved metrics and targets for each of these three commitments, as presented in the following tables.
| METRIC | PERFORMANCE 2021-22 | 2022-23 | TARGET |
|---|---|---|---|
| Number of gigawatts (GW) of renewable assets connected to network (small-scale and large-scale) | 2.575 GW of renewable assets connected to the network (1.375 GW small-scale and 1.2 GW large-scale) | 2.912 GW of renewable assets connected to the network (1.561 GW small-scale and 1.351 GW large-scale) |
4.2 GW of renewable assets connected to the network by 2029-30 (2.4 GW small-scale and 1.8 GW large-scale) |
| Number of alternative network solution projects commenced (total number of SAPS and microgrids) |
2 SAPS 1 microgrid |
4 SAPS 1 microgrid |
400 SAPS projects and 6 microgrid projects delivered by 2028-29 |
| Number of Essential Energy batteries connected to the network | 0 batteries | 1 battery | 29 Battery Energy Storage Systems (BESS) by 2029-30 |
| Electric vehicle (EV) adoption percentage in regional New South Wales (NSW) | 0.04% | 0.19% | Tracking only |
| Number of public EV fast chargers in regional NSW | 127 | 163 | Tracking only |
| METRIC | PERFORMANCE 2021-22 | 2022-23 | TARGET |
|---|---|---|---|
| System Average Interruption Duration Index (SAIDI) | 218 minutes | 222 minutes | Under or equal to 211 minutes of interruptions per customer per year |
| System Average Interruption Frequency Index (SAIFI) | 1.6 instances | 1.579 instances | Under or equal to 1.81 interruptions per customer per year |
| Major Event Days (MED) – number of and total duration threshold |
12 days 5.79 MED SAIDI threshold |
2 days 6.245 MED SAIDI threshold |
Tracking only |
| METRIC | PERFORMANCE 2021-22 | 2022-23 | TARGET |
|---|---|---|---|
| Scope 1 and 2 emissions – Tonnes of carbon dioxide equivalent (tCO2-e) | 555,533 tCO2-e | 552,531 tC02-e | Scope 1 and 2 emissions reduction of 50% by 2030, from a base year of 2020-21 |
| Scope 3 emissions (tCO2-e) | Not disclosed | 97,287 tC02-e | Tracking only |
| Total energy consumption (renewable and non-renewable) within organisation (GJ) | 2,653,139 GJ | 2,857,422 GJ | Tracking only |
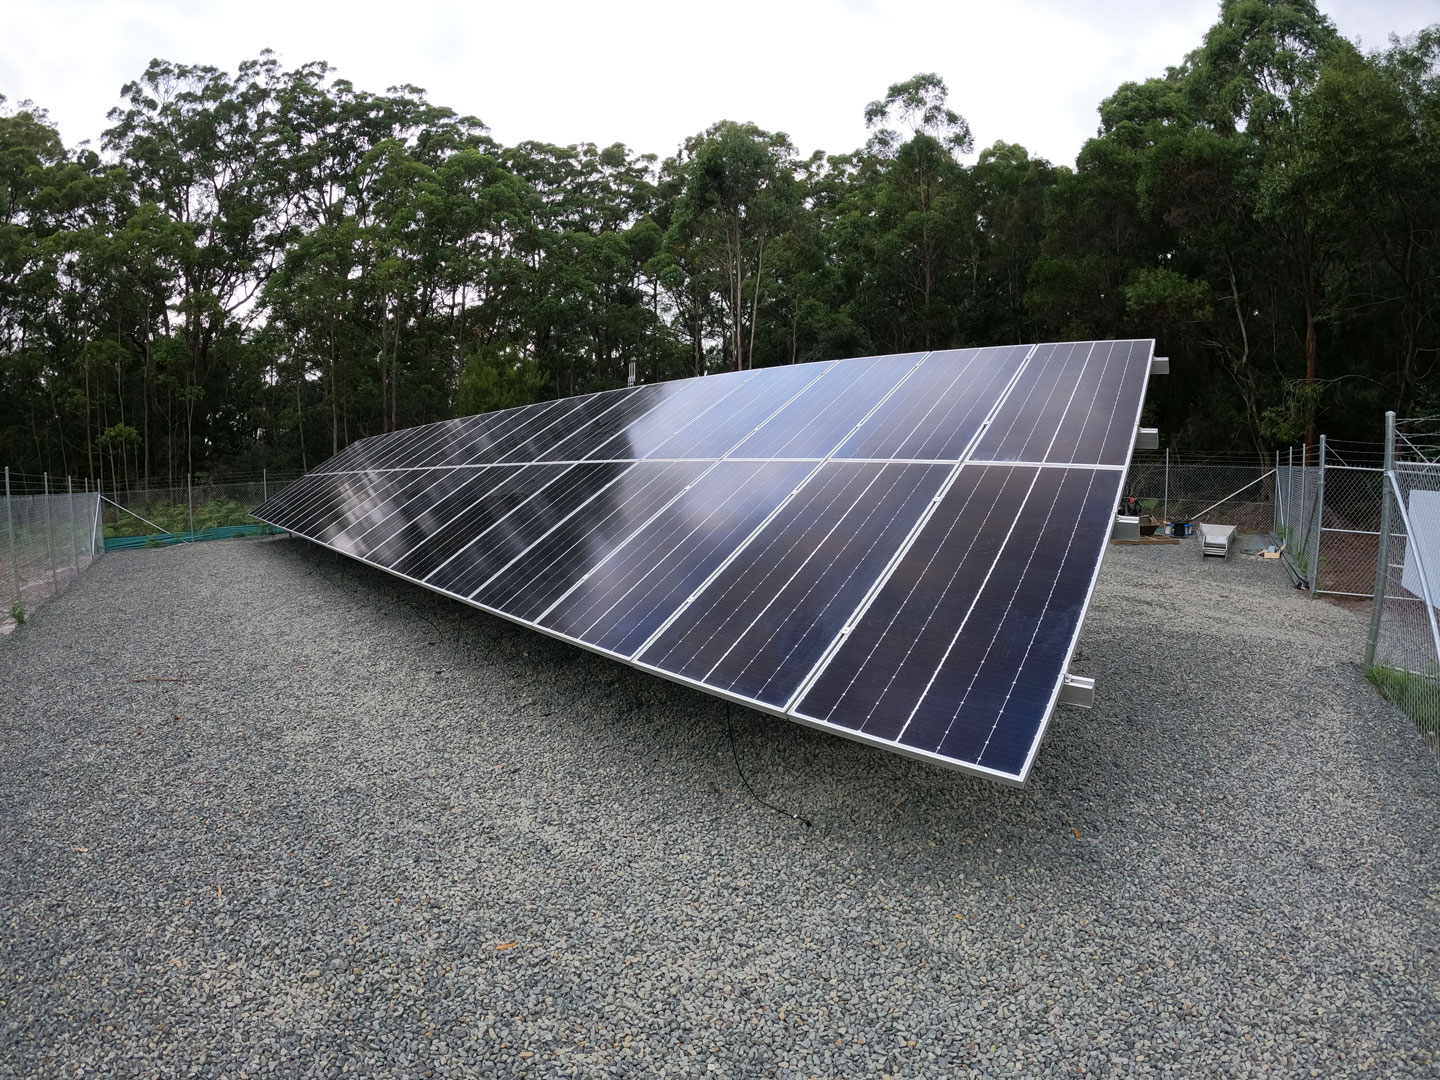
| Emissions reduction activities | 20 depots upgraded with solar panels | 20 depots upgraded with solar panels | 35 additional depots upgraded with solar panels by 2028-29 |
| Sulphur Hexafluoride (SF6) on network (kg) | 25,680 kg | 27,557 kg | Tracking only |
Our Scope 1, 2 and 3 emissions
We annually report Scope 1 and 2 greenhouse gas emissions in accordance with the National Greenhouse and Energy Reporting Act 2007, which provides emissions and intensity ratios for historical periods.
Our Scope 1 emissions are from: transport fuel use and stationary fuel use; Sulphur Hexafluoride (SF6) leakage in the electricity distribution network; and Essential Water fuel combustion and emissions of methane and nitrous oxide during wastewater handling.
Much of our emissions profile derives from our indirect, Scope 2 emissions. In 2022-23, 94 per cent of Scope 1 and 2 emissions were attributable to distribution loss emissions, which are emissions from the amount of energy lost distributing electricity across the grid before it reaches end users. Essential Energy is a regional network with 183,612 km of powerlines, and losses on our network are primarily driven by the need to distribute energy significant distances over regional, rural and remote NSW. The decarbonisation of the NSW generation mix will automatically reduce emissions in the coming years as more coal-fired generation shuts down and more locally-generated renewables are connected to the grid. In continuing to drive renewable connections, we are not only helping to facilitate the net zero transition but also reducing our emissions. Over the past five years, distribution network loss emissions have reduced by 14 per cent.
Our other Scope 2 emissions sources are from electricity consumption for Essential Energy and Essential Water facilities.
| YEAR (30 JUNE) | 2018-19 | 2019-20 | 2020-21 | 2021-22 | 2022-23 |
|---|---|---|---|---|---|
| Total Scope 1 (tCO2-e) | 26,921 | 27,578 | 25,746 | 23,868 | 25,919 |
| Total Scope 2 (tCO2-e) | 623,378 | 559,456 | 572,220 | 531,665 | 526,612 |
| Total Scope 1 and 2 emissions (tCO2-e) | 650,299 | 587,034 | 597,9666 | 555,533 | 552,531 |
| SCOPE 3 EMISSIONS CATEGORY | FY23 EMISSIONS (tCO2-e) |
|---|---|
| Category 1: Purchased Goods and Services | 50,434 |
| Category 3: Fuel & Energy-related Activities | 39,836 |
| Category 4: Upstream Transportation and Distribution | 1,356 |
| Category 5: Waste Generated in Operations | 1,723 |
| Category 6: Business Travel | 1,174 |
| Category 7: Employee Commute | 2,764 |
| Total Scope 3 Emissions | 97,287 |
Essential Energy is developing a transition plan and decarbonisation pathway that addresses Scope 1, 2 and 3 emissions. This year, as shown in table 10, we set a target to reduce greenhouse gas emissions by 50 per cent by 2030 (Scope 1 and 2, base year of 2020-21). This target is forecast to be achieved through a reduction of distribution network and electricity emissions from grid decarbonisation, as well as a reduction in fleet emissions from electrification and a reduction in electricity emissions from installing solar photovoltaic panels on depots. We are also looking at how we manage the use of SF6 on the network. We are developing strategies to address Scope 3 emissions, including through our purchased goods and services and waste emissions.