Climate-related financial disclosure
This disclosure describes how climate-related matters affect Essential Energy and its business activities, as the economy moves towards net zero. It details how we are planning for and managing climate-related risks and opportunities – physical risks and transition risks and opportunities.
Essential Energy recognises that this disclosure is an early adoption based on best endeavours, delivered ahead of sector-wide guidance being available, and therefore there may be limitations to the robustness and consistency of reporting.
This is a voluntary disclosure, informed by the Task Force on Climate-related Financial Disclosures (TCFD) and the Reporting Framework for Year One Climate-related Financial Disclosures (Framework) for NSW Government entities.
It builds on Essential Energy’s 2021-22 (PDF) and 2022-23 TCFD reports. The work of the TCFD culminated in July 2023, with the release of International Financial Reporting Standards (IFRS) S1 General Requirements for Disclosure of Sustainability-related Financial Information and S2 Climate-related Disclosures. The Australian Sustainability Reporting Standard AASB S2 Climate-related Disclosures is based on IFRS S21. For NSW Government entities, including Essential Energy, the Framework aligns with the AASB S2, with some NSW Government-specific modifications.
In preparation for mandatory reporting against the Framework in the 2024-25 Annual Report, over the past year a gap assessment and high-level roadmap have been completed – to understand and plan for the required capability and reporting uplift.
Some actions will require significant investment, including incorporating robust quantitative climate change scenario analyses into strategic planning, and resulting financial, network and risk management planning. Improving data management and further developing a transition plan will also need focused investment.
1. The submitted and published PDF for the Essential Energy Annual Report references the draft Australian standards. These were finalised in September 2024.
Governance
Board role and responsibilities
The Board has ultimate oversight of Essential Energy’s strategic response to climate-related risks and opportunities. These are central to the sustainability of the business, meaning that the approaches taken are core to the Corporate Strategy, Regulatory Proposal, Sustainability Strategy and operational strategies – including Essential Energy’s Resilience Plan, Bushfire Prevention Strategy and Vegetation Management Strategy.
The Corporate Strategy is approved by the Board and explicitly addresses multiple climate-related transition opportunities, including supporting the uptake of renewable energy solutions, facilitating electric vehicle (EV) adoption, and enabling smart energy solutions for regional communities. External factors relevant to the Corporate Strategy are monitored and reviewed by the Board every six months. Other transition risks and opportunities arising from climate-related regulation, policy or market activity are considered and addressed by the Board as part of business-as-usual strategic and financial planning.
The Board approves the Sustainability Strategy and the metrics and targets that monitor performance across the three sustainability strategic pillars: Responding to climate change; Enabling regional development and resilient communities; and Empowering our people. The ‘Responding to climate change’ pillar contains three commitments: Building climate resilience; Facilitating the net zero transition; and Decarbonising our operations.
Climate and sustainability topics are specifically discussed by multiple Board sub-committees, including:
- Safety, Human Resources and Environment Committee – which reviews performance against the Sustainability Strategy on a quarterly basis
- Risk and Cyber Security Committee – which a) ensures an appropriate framework for identifying and managing risks arising from climate change (including physical, transition and liability risks) and b) monitors strategic and business risks, including climate change and other sustainability and environmental risks
- Audit Committee – which oversees and reviews climate-related disclosures.
Together with Management, the Board continues to increase its understanding of the implications of climate-related risks and opportunities on our business and the energy industry, including through training and education. This positions the Board to continue steering the organisation towards best practices, including planning and reporting for climate-related risks and opportunities.
Management role and responsibilities
Management is responsible for delivering on the Corporate Strategy, Regulatory Proposal and Sustainability Strategy, as well as operational strategies.
Management reviews performance against the Sustainability Strategy on a quarterly basis. The Sustainability Steering Committee (SSC) is a subcommittee comprised of the entire Executive Leadership Team (Management) and chaired by the Chief Corporate Affairs Officer.
This Committee is responsible for addressing key risks and issues regarding the implementation of the Sustainability Strategy.
During 2023–24, the Sustainability Steering Committee endorsed the outcomes from the climate reporting gap assessment, the resulting roadmap for capability and reporting uplift, and the formation of the Climate Working Group to oversee roadmap implementation.
The Sustainability Working Group is responsible for the delivery of the Sustainability Strategy and climate-related initiatives. It is chaired by the Head of Sustainability and includes subject matter experts from across the organisation.
The Climate Working Group, formed during 2023–24, will guide the implementation of the climate reporting roadmap and prepare Essential Energy for reporting against the Framework for NSW Government entities. It includes members of the sustainability, finance, strategy, risk management, governance and network planning functions.
Strategy
Essential Energy’s Corporate Strategy is delivering critical change to respond to climate-related risks and seize opportunities from the energy transition.
It recognises that customer, investor, regulatory and societal expectations of Essential Energy are shifting. Essential Energy is evolving how the distribution network best contributes to the future energy needs of regional, rural and remote communities.
The material climate-related risks and opportunities that shape the Corporate Strategy can be grouped into two broad areas of impact on the business, stakeholders and customers: 1) the physical environment; and 2) the broader market, societal and regulatory landscape.
The physical environment impacts Essential Energy’s assets and network management, as well as the prosperity, safety and wellbeing of the communities we serve. To respond, Essential Energy has prioritised investments that add resilience, flexibility, safety and agility to network assets, network control and operations. The business and the communities Essential Energy serves will benefit from more dynamic assets and modern operations that can better predict climate impacts, manage Consumer Energy Resources (CER) and safely withstand major climate events.
The broader market, societal and regulatory landscape affects the value the network generates, its role in the industry and the services offered to customers. Essential Energy’s Corporate Strategy affirms a commitment to empower communities to share and use energy for a better tomorrow by evolving the energy platform, developing commercial capabilities to attract new investment into regional communities, and expanding into underserviced, unregulated activities.
Essential Energy refined its Corporate Strategy during 2023–24, broadening the focus to the five strategic pillars described in the Strategy section. Consistent with previous approaches, this refinement was informed by an extensive external landscape review by the Board and Management, including technological possibilities, economic trends, and enabling regulatory plans and frameworks such as the Climate Change (Net Zero Future) Act 2023 (NSW) and the NSW Electricity Strategy, NSW Electric Vehicle Strategy and NSW Hydrogen Strategy. The review supported Board and Management discussions of Essential Energy’s desired role within the energy transition.
Climate risks and opportunities
Essential Energy undertook a double materiality assessment during 2023–24, determining the sustainability-related topics most likely to impact the business and stakeholders. It included an analysis of the megatrends influencing the current and future operating environment. The process identified 61 sustainability-related impacts, risks and opportunities (IROs) material to Essential Energy’s business, including climate-related IROs. Material IROs were then grouped under eight sustainability priorities, four of which are climate-related: 1) Adapting our business to the clean energy future; 2) Supporting an affordable and inclusive clean energy transition; 3) Strengthening resilience to climate events; and 4) Minimising environmental impact. The materiality assessment will inform Essential Energy’s corporate, sustainability and operational planning, as well as risk management and sustainability and climate-related reporting – including the risks and opportunities listed in tables 7 to 14. For more information see Sustainability materiality.
Physical climate risks have long been established considerations within Essential Energy’s network management planning and processes.
A register of physical risks affecting the electricity network is maintained, including those relating to weather events. The impacts of these risks could potentially involve the failure of network assets or an inability to respond to significant network outages due to limited physical access to the network.
During 2021–22, the business undertook a Climate Impact Assessment (CIA), as a detailed quantitative scenario analysis for climate-related physical risks from bushfires, storms and floods. This informed network resilience investment in Essential Energy’s 2024-29 Regulatory Proposal and therefore network resilience initiatives over the coming five years.
Tables 7 to 14 (below) provide a shortlist of Essential Energy’s material climate-related risks and opportunities, combining both physical and transition risks on the one hand, and transition opportunities on the other. In this context, short term is defined as zero to five years, medium term as five to ten years, and long term as beyond ten years. This aligns with the five-yearly funding cycle via Regulatory Proposals.
| Type: Physical – Chronic and Acute | Time horizon: Short to long term |
|---|---|
| POTENTIAL IMPACTS | BUSINESS RESPONSES |
|
|
| Type: Physical – Acute | Time horizon: Short to long term |
|---|---|
| POTENTIAL IMPACTS | BUSINESS RESPONSES |
|
Same as Risk 1. Additionally:
|
Same as Risk 1. Additionally:
|
| Type: Transition – Markets | Time horizon: Short to medium term |
|---|---|
| POTENTIAL IMPACTS | BUSINESS RESPONSES |
|
Skills shortages risk mitigation measures:
Materials and equipment shortages risk mitigation measures:
|
| Type: Transition – Technology | Time horizon: Short to medium term |
|---|---|
| POTENTIAL IMPACTS | BUSINESS RESPONSES |
|
|
| Type: Transition – Technology | Time horizon: Short to medium term |
|---|---|
| POTENTIAL IMPACTS | BUSINESS RESPONSES |
|
Customer-related:
Regulation-related:
Community engagement:
|
| Type: Resource efficiency/Resilience | Time horizon: Short to medium term |
|---|---|
| POTENTIAL IMPACTS | BUSINESS RESPONSES |
|
Continuing to develop a series of new solutions that add flexibility and resilience to the network:
|
| Type: Markets, Resource Efficiency | Time horizon: Short to medium term |
|---|---|
| POTENTIAL IMPACTS | BUSINESS RESPONSES |
|
Essential Energy and our customers stand to benefit from the net zero transition as substantial new load and generation connect to the network over the next decade. This will bring new investment and new industry to regional and rural NSW, and improve the utilisation of the existing network, resulting in a broader and more diverse customer base to recover network costs. |
|
| Type: Markets, Resource Efficiency | Time horizon: Short to medium term |
|---|---|
| POTENTIAL IMPACTS | BUSINESS RESPONSES |
|
The energy transition is opening the possibility of new business models and new paths to value, which is a significant opportunity in regional and rural NSW. Customers have growing choice in how they connect to the network and consume and generate electricity, which will require the energy industry to evolve the design of the market. This evolution will likely involve the development or new services, adjacent markets and new commercial arrangements to leverage the existing electricity network for the net zero transition. |
|
Scenario analysis
Climate scenario analysis helps us to understand the potential future effects of different climate change scenarios on business activities and strategy.
Physical risks
During 2021-22, external specialists developed Essential Energy’s Climate Impact Assessment (CIA), which modelled scenarios to quantify the financial and non-financial impacts of physical climate events on network assets. Inputs included the Intergovernmental Panel on Climate Change emission trajectories Representative Concentration Pathways (RCPs) 4.5 and 8.5 over the time horizons of 2050, 2070 and 2090. This work informed the resilience initiatives included in the final determination for the 2024–29 Regulatory Proposal. Essential Energy commenced integrating modelling outcomes into asset management systems during 2023–24, to inform ongoing long-term planning.
Transition risks and opportunities
During 2022–23 scenarios were developed to explore transition risks and opportunities, using internal strategic analysis and resources including the Shared Socioeconomic Pathways (SSPs) and the physical risks identified in the CIA. Senior leaders and subject matter experts mapped these scenarios to help understand the social, technical and economic impacts of a changing climate on Essential Energy’s customers and the energy sector. These scenarios were described in the 2022–23 TCFD report.
Resilience
Essential Energy has an integrated approach to business resilience, network resilience and community resilience. This integration is important for consistency of direction and alignment to the Corporate Strategy.
Essential Energy’s Resilience Plan 2024–29, developed in early 2023, focuses on network resilience and community resilience. It contains investment and actions to mitigate the effects of climate-related risks on the network and therefore continue to provide safe and reliable power for regional and rural customers and communities.
The plan was informed by the CIA for the physical network, as well as extensive stakeholder engagement for Essential Energy’s 2024-29 Regulatory Proposal, in which customers identified improving the resilience of the network as a top priority.
The final determination for the 2024–29 Regulatory Proposal contained $205 million in investments to improve the resilience of the network.
Investments include:
- installing 11,000 composite poles in high-risk areas by 2029 (see Composite poles for details)
- commissioning microgrids, and exploring ways to improve their economic feasibility
- installing SAPS in up to 400 locations, initially targeting hard-to-access and high-cost-to-serve areas (see SAPS for details)
- relocating the Lismore depot away from flood-prone land
- procuring portable and adaptable assets that can be transported to different locations, including mobile switchboards, streetlights, community hubs, solar panels, batteries and generators
- laying selected powerlines underground in high-risk locations, to minimise exposure to bushfires and storms
- hiring three additional staff to help local government councils, communities and critical infrastructure asset providers develop resilience plans.
Additionally, during 2023–24 Essential Energy secured an Australian Government grant from the Telecommunications Disaster Resilience Innovation (TDRI) Program, to procure six emergency response SAPS and complete enabling works to accept ‘plug-in backup supply’ at a minimum of 12 sites. The sites house vital telecommunications systems, owned by Essential Energy and emergency services. The total investment will be $1.88 million, with 50 per cent from the grant and 50 per cent from Essential Energy. A further $724,000 from Essential Energy’s revenue base has been allocated to installing permanent solar and battery backup systems for approximately 20 critical Essential Energy radio sites.
We are also working to improve network and community resilience for severe weather events through collaboration between essential power and telecommunications providers. During the past year we initiated a joint forum for NSW power, telecommunications and state government agencies, to achieve better service outcomes for customers. This addresses recommendations arising from the 2019–20 Black Summer inquiries.
Alongside network and community resilience, Essential Energy’s core business resilience functions and considerations, such as enterprise risk management and physical and cyber security, are addressed in a separate business resilience plan aligned to ISO 22313 – Business Continuity Management Systems.
Risk management
As detailed above, in 2021–22 the CIA modelled the expected impact of the physical impacts of climate change on Essential Energy’s network assets and customer experience. It combined historical asset failure data with expert judgement and a literature review. The NSW Government Climate Risk Ready tool was also used, to supplement existing risk assessments and identify risks that may benefit from longer-term quantitative assessments to identify potential impacts and mitigation options.
The assessment produced comprehensive forecast models for bushfires, floods and windstorms, including location-specific data that informed the projected timings and plans for mitigative measures. In evaluating physical risks, the projected impact of climate-driven sustained power outages on the customer experience was modelled using the industry standard metric Value of Customer Reliability. This generated economic quantification of the impacts of sustained power outages resulting from the increase in climate-driven bushfires, floods and windstorms.
As an electricity network owner, Essential Energy evaluates and addresses physical risks as part of business-as-usual risk management, primarily through the Strategic Asset Management Plan and individual asset management strategies.
Risks are rated according to a common risk matrix identifying likelihood and potential consequences. Through the risk management framework, the possibility of additional organisational impacts from an asset’s failure is also assessed – including for safety, reliability, financial performance, the environment, compliance, reputation or community standing.
Essential Energy recognises that it is not practical or efficient to eliminate the potential impacts of natural hazards and extreme weather events. The approach to limiting the impact of these events includes maintaining incident response capabilities that mitigate the physical impacts of climate hazards and disaster events such as floods, storms and bushfires, by restoring power following the outages they cause.
Essential Energy’s existing risk register includes risks affected by transition risks as well as physical risks. These are not necessarily tagged as climate-related risks, as both their causes and impacts can be broader. For example, energy volatility could derive from climate-related risks or other factors.
Risks are rated according to a common risk matrix identifying likelihood and potential consequences. These risks are all addressed at Board and Management level, mostly through ongoing monitoring of the factors underpinning the Corporate Strategy and the metrics and targets identified in the Sustainability Strategy (see tables 15 to 17 below).
Metrics and targets
In 2023–24 the Board approved metrics and targets for the three commitments within the Responding to climate change pillar of the Sustainability Strategy. The metrics and targets are the same as those for 2022–23. See tables 15 to 17 below.
| METRIC | 2021-22 | 2022-23 | 2023-24 | TARGET |
|---|---|---|---|---|
| Number of gigawatts (GW) of renewable assets connected to network (small-scale and large-scale) | 2.575 GW of renewable assets connected to the network (1.375 GW small-scale and 1.2 GW large-scale) | 2.912 GW of renewable assets connected to the network (1.561 GW small-scale and 1.351 GW large-scale) |
3.62GW of renewable assets connected to the network (2.084GW small-scale and 1.536GW large-scale) | 4.2 GW of renewable assets connected to the network by 2029-30 (2.4 GW small-scale and 1.8 GW large-scale) |
| Number of alternative network solution projects commenced (total number of SAPS and microgrids) |
2 SAPS 1 microgrid |
4 SAPS 1 microgrid |
29 SAPS 3 microgrids |
400 SAPS projects and 6 microgrid projects delivered by 2028-29 |
| Number of Essential Energy batteries connected to the network | 0 batteries | 1 battery | 3 batteries | 29 Battery Energy Storage Systems (BESS) by 2029-30 |
| EV adoption percentage in regional NSW | 0.04% | 0.19% | 0.33% | Tracking only |
| Number of public EV fast chargers in regional NSW | 127 | 163 | 288 | Tracking only |
| METRIC | 2021-22 | 2022-23 | 2023-24 | TARGET |
|---|---|---|---|---|
| System Average Interruption Duration Index (SAIDI) | 218 minutes | 222 minutes | 206 minutes | Under or equal to 226 minutes of interruptions per customer per year |
| System Average Interruption Frequency Index (SAIFI) | 1.6 instances | 1.579 instances | 1.523 instances | Under or equal to 1.71 interruptions per customer per year |
| Major Event Days (MED) – number of and total duration threshold |
12 days 5.79 MED SAIDI threshold |
2 days 6.245 MED SAIDI threshold |
2 days 6.22 MED SAIDI threshold |
Tracking only |
| METRIC | 2021-22 | 2022-23 | 2023-24 | TARGET |
|---|---|---|---|---|
| Scope 1 and 2 emissions – Tonnes of carbon dioxide equivalent (tCO2-e) | 557,516 tCO2-e | 554,040 tC02-e | 537,437 tC02-e | Scope 1 and 2 emissions reduction of 50% by 2030, from a base year of 2020–21 |
| Scope 3 emissions (tCO2-e) | Not disclosed | 135,310 tC02-e | 126,097 tC02-e | Tracking only |
| Total energy consumption (renewable and non-renewable) within organisation (GJ) | 2,662,174 GJ | 2,864,865 GJ | 2,964,646 GJ | Tracking only |
| Emissions reduction activities | 0 EVs | 34 EVs | 55 EVs | 850 light vehicles moved to EVs by 2028–29 104 heavy vehicles moved to EVs by 2028–29 |
| Sulphur Hexafluoride (SF6) on network (kg) | 25,680 kg | 27,557 kg | 27,995 kg | Tracking only |
2. The Essential Energy 2022-23 and 2021-22 annual reports and the 2021-22 TCFD contained incorrect figures for total energy consumption, total Scope 2 emissions, and total Scope 1 and 2 emissions, for 2019-20 to 2022-23. Tables 17 and 18 contain the corrected figures. The error was due to the omission of two Essential Water pump sites from the Essential Energy master site list, which is used to calculate total electricity usage. This meant that approximately 1,500 to 2,000 tCO2-e were missing from total Scope 2, each year. An internal review of the master site list in August 2024 identified the omission. This review will now be conducted annually.
3. Total Scope 3 emissions for 2022-23 are restated in Table 17, compared to the amounts included in the Essential Energy Annual Report 2022-23. See ‘Change of methodology for Scope 3 emissions’ below.
Scope 1, 2 and 3 emissions
Essential Energy annually reports Scope 1 and 2 greenhouse gas (GHG) emissions in accordance with the National Greenhouse and Energy Reporting Act 2007 (Cth), which provides emissions and intensity ratios for historical periods.
Essential Energy’s Scope 1 emissions are from: transport fuel use and stationary fuel use; Sulphur Hexafluoride (SF6) leakage in the electricity distribution network; and Essential Water fuel combustion and emissions of methane and nitrous oxide during wastewater handling.
Much of Essential Energy’s emissions profile derives from indirect, Scope 2 emissions. In 2023–24, 93 per cent of Scope 1 and 2 emissions were attributable to distribution loss emissions, which are emissions from the amount of energy lost distributing electricity across the grid before it reaches end users.
As a regional network with more than 183,000km of overhead powerlines, losses on the network are primarily driven by the significant distances needed to distribute energy across regional, rural and remote NSW. The decarbonisation of the NSW generation mix will automatically reduce emissions in the coming years as more coal-fired generation shuts down and more locally-generated renewables are connected to the grid.
In continuing to drive renewable connections, Essential Energy is both helping to facilitate the net zero transition and reducing its emissions. Since 2018-19, distribution network loss emissions from the Essential Energy network have reduced by 17 per cent.
Other Scope 2 emissions sources are electricity consumption for Essential Energy and Essential Water facilities.
| YEAR (30 JUNE) | 2018-19 | 2019-20 | 2020-21 | 2021-22 | 2022-23 | 2023-24 |
|---|---|---|---|---|---|---|
| Total Scope 1 (tCO2-e) | 26,921 | 27,578 | 25,746 | 23,868 | 25,919 | 26,515 |
| Total Scope 2 (tCO2-e) | 623,378 | 561,498 | 574,090 | 533,648 | 528,121 | 510,922 |
| Total Scope 1 and 2 emissions (tCO2-e) | 650,299 | 589,079 | 599,836 | 557,516 | 554,040 | 537,437 |
4. The Essential Energy 2022-23 and 2021-22 annual reports and the 2021-22 TCFD contained incorrect figures for total energy consumption, total Scope 2 emissions, and total Scope 1 and 2 emissions, for 2019-20 to 2022-23. Tables 17 and 18 contain the corrected figures. The error was due to the omission of two Essential Water pump sites from the Essential Energy master site list, which is used to calculate total electricity usage. This meant that approximately 1,500 to 2,000 tCO2-e were missing from total Scope 2, each year. An internal review of the master site list in August 2024 identified the omission. This review will now be conducted annually.
Figure 3. Combined Scope 1 and 2 greenhouse gas emissions5
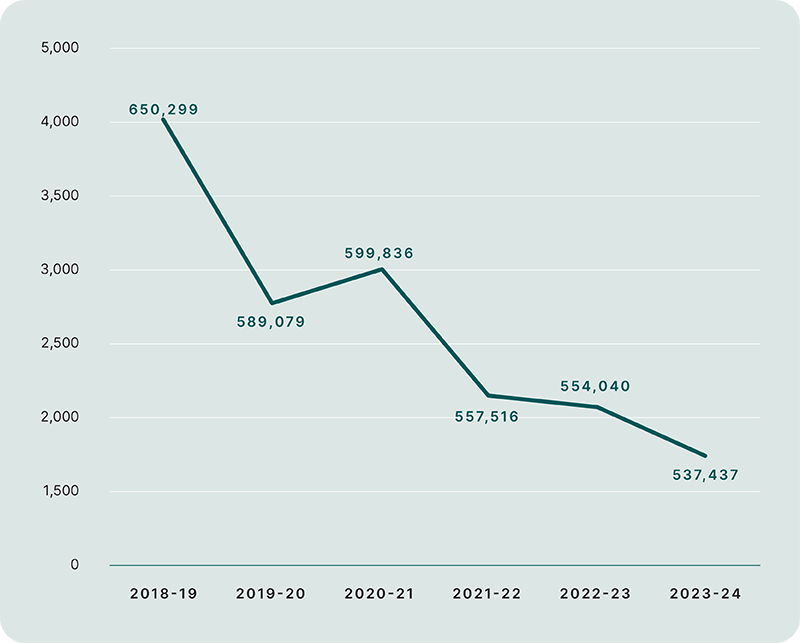
5. Figure 3 contains updated amounts for 2019–20 to 2022–23 compared to the Essential Energy Annual Report 2022–23. The Essential Energy 2022-23 and 2021-22 annual reports and the 2021-22 TCFD contained incorrect figures for total energy consumption, total Scope 2 emissions, and total Scope 1 and 2 emissions, for 2019-20 to 2022-23. Tables 17 and 18 contain the corrected figures. The error was due to the omission of two Essential Water pump sites from the Essential Energy master site list, which is used to calculate total electricity usage. This meant that approximately 1,500 to 2,000 tCO2-e were missing from total Scope 2, each year. An internal review of the master site list in August 2024 identified the omission. This review will now be conducted annually.
| SCOPE 3 EMISSIONS CATEGORY | 2022-231 (tCO2-e) | 2023-24 (tCO2-e) |
|---|---|---|
| Category 1: Purchased Goods and Services | 85,921 | 95,826 |
| Category 3: Fuel & Energy-related Activities | 40,309 | 19,543 |
| Category 4: Upstream Transportation and Distribution | 3,419 | 4,476 |
| Category 5: Waste Generated in Operations | 1,723 | 2,119 |
| Category 6: Business Travel | 1,174 | 1,173 |
| Category 7: Employee Commute | 2,764 | 2,960 |
| Total Scope 3 Emissions | 135,310 | 126,097 |
6. Total Scope 3 emissions for 2022-23 are restated in Table 19, compared to the amounts included in the Essential Energy Annual Report 2022-23. See ‘Change of methodology for Scope 3 emissions’, below.
Change of methodology for Scope 3 emissions
Scope 3 emissions data for 2022-23 is restated in tables 17 and 19 from the amounts included in the Essential Energy Annual Report 2022-23. This is due to a change of methodology, transitioning emission factors from Environmentally-Extended Input-Output (EEIO) factors to Climate Active factors. This change aligns with current best practices. It enhances the traceability of Essential Energy’s emission factors, for future assurance purposes. It also better aligns Essential Energy’s reporting to the Australian context and with energy industry peers, with Climate Active factors used more commonly. This adjustment reflects Essential Energy’s commitment to transparent, accurate and accountable reporting practices in accordance with industry best practices.
As a result of this change, total 2022-23 Scope 3 emissions are 39 per cent higher compared to the amounts included in the 2022-23 Annual Report. Total Scope 3 emissions decreased by 7 per cent in 2023-24, compared to the restated amount for 2022-23.
Decarbonisation initiatives
Essential Energy continues to develop a transition plan and decarbonisation pathway to address Scope 1, 2 and 3 emissions. As shown in Table 17, in 2022–23 a target was set to reduce GHG emissions by 50 per cent by 2030 (Scope 1 and 2, base year of 2020-21). This target is forecast to be achieved through a reduction of distribution network and electricity emissions from grid decarbonisation, as well as a reduction in fleet emissions from electrification, and a reduction in electricity emissions from installing solar photovoltaic panels on depots. Work is also being done to reduce and eliminate the use of SF6 on the network. We are developing strategies to address Scope 3 emissions, including through purchased goods and services and waste emissions.